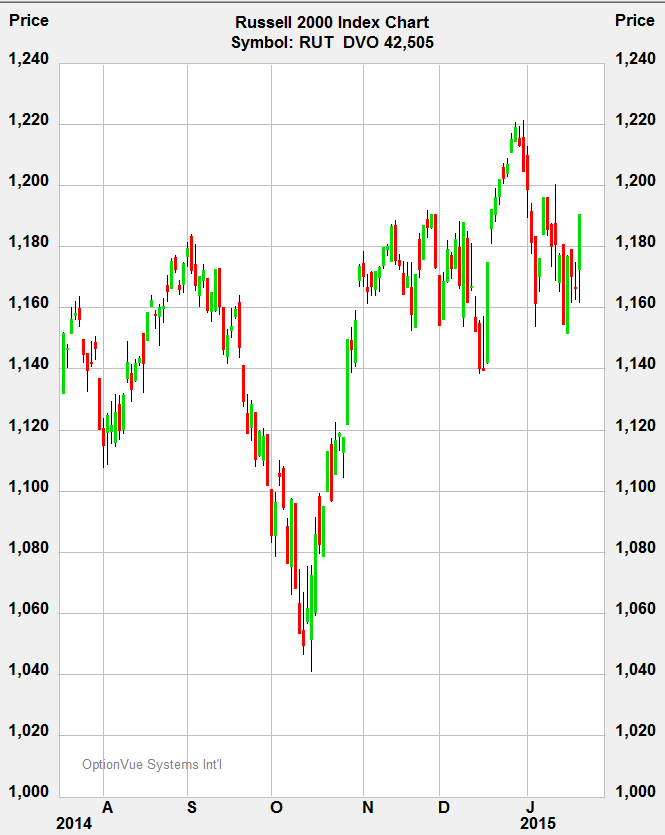
On January 23rd 2015 the market was up Average IV was 18.3% at the time of entry around 10:30am.
Trade entry:

Risk graph:

Adjustments:
- Jan 28 – That was a sharp down move of -14.30 pts, this volatility hit resulted in market makers taking the price out of my butterflies. As a result my absolute loss (ABS Loss) was increase to -$4000
- As a result of an increase in ABS Loss, my threshold when assessing t+0 line will be $1500 - $2000
- Feb 2 - Sold 5 x 1150 Put Verticals to protect my t+0 downside risk
- Feb 5 - Bought 3 x 1150 and Sold 3 x 1170 Put Verticals to protect my t+0 upside risk
- Feb 13 - Bought 5 x 1150 and Sold 5 x 1170 Put Verticals to correct VEGA to negative
- Ended up switching daily time check to 15:00, b/c 15:30 wasn't providing price data.
- Feb 18 - Rolled up the BF b/c price was 16 pts above my upper wing and to correct VEGA to negative
- Split the short strike to 10 x 1210 and 10 x 1200 Put Verticals to protect t+0 upside risk
- Switched timecheck back to 15:30 moving forward
- Feb 24 - Bought 5 x 1210 and Sold 5 x 1220 Put Verticals to control DELTA at the inner edge of the tent
- Feb 26 - Bought 5 x 1210 and Sold 5 x 1220 Put Verticals to control DELTA at the inner edge of the tent
- Mar 2 - Bought 5 x 1220 and Sold 5 x 1230 Put Verticals to control DELTA at the inner edge of the tent
- Mar 6 - Bought 5 x 1230 and Sold 5 x 1220 Put Verticals to control positive DELTA
- Bought 3 x 1220 and Sold 3 x 1210 Put Verticals to protect t+0 downside risk
- Mar 9 - Exited at Max Profit of +$3172
