Friday, 25 March 2016

Backtesting 2016 - Mar 24, 2016 Entry

Account: Blog backtesting 2016
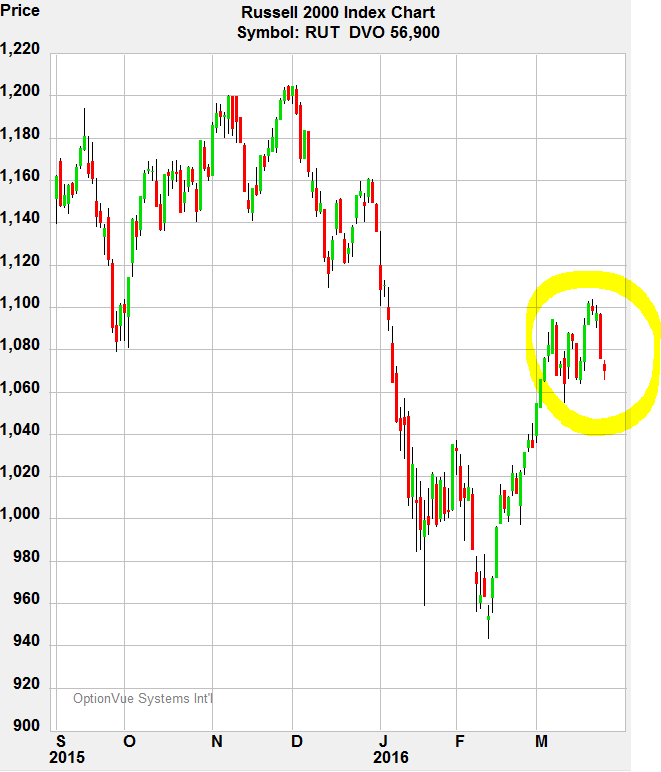
On Mar 24, 2016 this trade was 57 DTE, I entered the trade at this date b/c the correct 56 DTE was "Good Friday" holiday and the markets were closed. On Mar 24, 2016 the market was up and Average IV was 18.8% at the time of entry around 10:30am.

Trade entry:


Adjustments:

  • Mar 29 - Rolled the position up, couldn't keep VEGA and DELTA negative
  • Apr 13 - Sold 7 x 1090 to control DELTA outside tent
  • Apr 19 - Sold 3 x 1090 to control VEGA outside tent
  • Apr 20 - Sold 5 x 1100 to control VEGA outside tent
  • Apr 22 - Sold 5 x 1100 to control VEGA outside tent
  • Apr 26 - Rolled BF up, can't keep DELTA and VEGA negative and RUT was 28 pts above upper wing
  • Apr 27 - Sold 8 x 1140 to reduce DELTA inside tent
  • Apr 29 - Sold 5 x 1120 to reduce DELTA inside tent
  • May 2 - Sold 5 x 1130 to protect t+0 upside
  • May 3 - Sold 5 x 1110 to reduce DELTA
  • May 4 - Sold 5 x 1100 to reduce DELTA
  • May 6 - Exited the trade 14 DTE at Max Profit + $3339

Friday, 22 January 2016

Backtesting 2016 - Jan 22, 2016 Entry

Account: Blog backtesting 2016
On Jan 22, 2016 the market was up and Average IV was 24.1% at the time of entry around 10:30am.

Trade entry:


Adjustments:

  • Feb 8 - Rolled BF down b/c of a two days of down moves and controlling DELTA 
  • Feb 11 - Sold 10 x 930 to control DELTA inside tent
  • Feb 17 - Sold 5 x 950 & 5 x 960 to control VEGA outside tent
  • Feb 22 - Rolled BF up b/c can't keep DELTA and VEGA negative and RUT is 31 pts above upper wing
  • Feb 24 - Sold 7 x 1000 to protect t+0 upside
  • Feb 26 - Sold 3 x 1000 to proteect t+0 upside
  • Feb 29 - Sold 5 x 10¹⁰ to control DELTA outside tent and upside t+0 risk
  • Mar 1 - Sold 5 x 10¹⁰ to control VEGA
  • Mar 2 - Rolled BF up, can't keep DELTA and VEGA negative
  • Mar 3 - Sold 5 x 1060 to control DELTA
  • Mar 10 - Sold 4 x 1060 to control DELTA 
  • Mar 11 - Exited the trade 7 DTE at a loss - $413

Friday, 20 November 2015

Backtesting 2015 - Nov 20, 2015 Entry

On November 20, 2015 the market was up and Average IV was 16.3% at the time of entry around 10:30am.


Trade entry:


Adjustments:

  • Dec 9 - Exited the trade slightly lower than Max Profit target at +$2419
    • Exited the trade b/c it was within +/- $100 of my target and I had no adjustments to the trade.


Friday, 25 September 2015

Backtesting 2015 - Sep 25, 2015 Entry

On September 25, 2015 the market was down and Average IV was 21.2% at the time of entry around 10:30am.


Trade entry:


Risk graph:


Adjustments:

  • Sep 28 - Sold 6 x 1090 Put Verticals to protect t+0 downside risk
  • Sep 29 - Sold 3 x 1080 Put Verticals to protect t+0 downside risk
  • Sep 30 - Sold 1 x 1120 Put Verticals to protect t+0 upside risk
  • Oct 5 - Sold 2 x 1120 Put Verticals to protect t+0 upside risk
  • Oct 15 - Sold 2 x 1130 Put Verticals to protect t+0 upside risk
  • Oct 23 - Sold 2 x 1130 Put Verticals to protect t+0 upside risk
  • Oct 28 - Sold 2 x 1140 Put Verticals to protect t+0 upside risk
  • Nov 2 - Rolled the BF up 50 pts
    • Split the Short side of the BF into 10 x 1160, 5 x 1170, 5 x 1190 to protect t+0 upside risk
  • Nov 6 - Sold 4 x 1180 and 1 x 1200 to hedge upside t+0 risk
  • Exited the trade slightly lower than Max Profit target at +$2136 (b/c I was running out of runway with 9 DTE combined with high Gamma risk) 


Friday, 21 August 2015

Backtesting 2015 - Aug 21, 2015 Entry

On August 21, 2015 the market gapped down and Average IV was 22.0% at the time of entry around 10:30am.


Trade entry:


Risk graph:


Adjustments:

  • Aug 24 – That was a sharp down move of -46.60 pts, this volatility hit resulted in market makers taking the price out of my butterflies. As a result my absolute loss (ABS Loss) was increase to -$4000
    • As a result of an increase in ABS Loss, my threshold when assessing t+0 line will be $1500 - $2000
    • Bought 5 x 1120 and Sold 5 x 1110 Put Verticals to protect my t+0 downside risk
  • Sep 11 - Bought 5 x 1110 and Sold 5 x 1140 Put Verticals to protect my t+0 upside risk, my t+0 was starting to sag and I decided to flatten it out
  • Sep 23 - Exited at Max Profit of +$2825

Video Recap of Trade


Friday, 24 July 2015

Backtesting 2015 - July 24, 2015 Entry

On July 24, 2015 the market gapped down and Average IV was 14.8% at the time of entry around 10:30am.


Trade entry:


Risk graph:


Adjustments:

  • Aug 7 - Exited at Max Profit of +$2611

Video Recap of Trade


Saturday, 27 June 2015

Backtesting 2015 - Jun 26, 2015 Entry (2nd attempt with adjustment on Jul 8)

On June 26, 2015 the market had a the past 3 days down at 1282 and Average IV was 14.7% at the time of entry around 10:30am.


Trade entry:


Risk graph:


Adjustments:

  • Jun 29 - There was a sharp down move of -28 pts, this volatility hit resulted in market makers taking the price out of my butterflies. As a result my absolute loss (ABS Loss) was increase to -$4000
    • As a result of an increase in ABS Loss, my threshold when assessing t+0 line will be $1500 - $2000
    • Bought 5 x 1250 and Sold 5 x 1240 to protect my t+0 downside risk
  • Jul 8 - RUT dropped 21.30 pts down and I decided to roll the BF down 50 pts to protect my t+0 downside risk
  • Jul 13 - Bought 10 x 1200 and Sold 10 x 1210 to control positive VEGA 
  • Jul 14 - Rolled the BF up 40 pts b/c RUT price was 23 pts above my upper wing
    • Bought 10 x 1240 and Sold 10 x 1250 to protect my t+0 upside risk
  • Jul 22 - Exited trade at Max Profit +$3078


Video Recap of Trade